
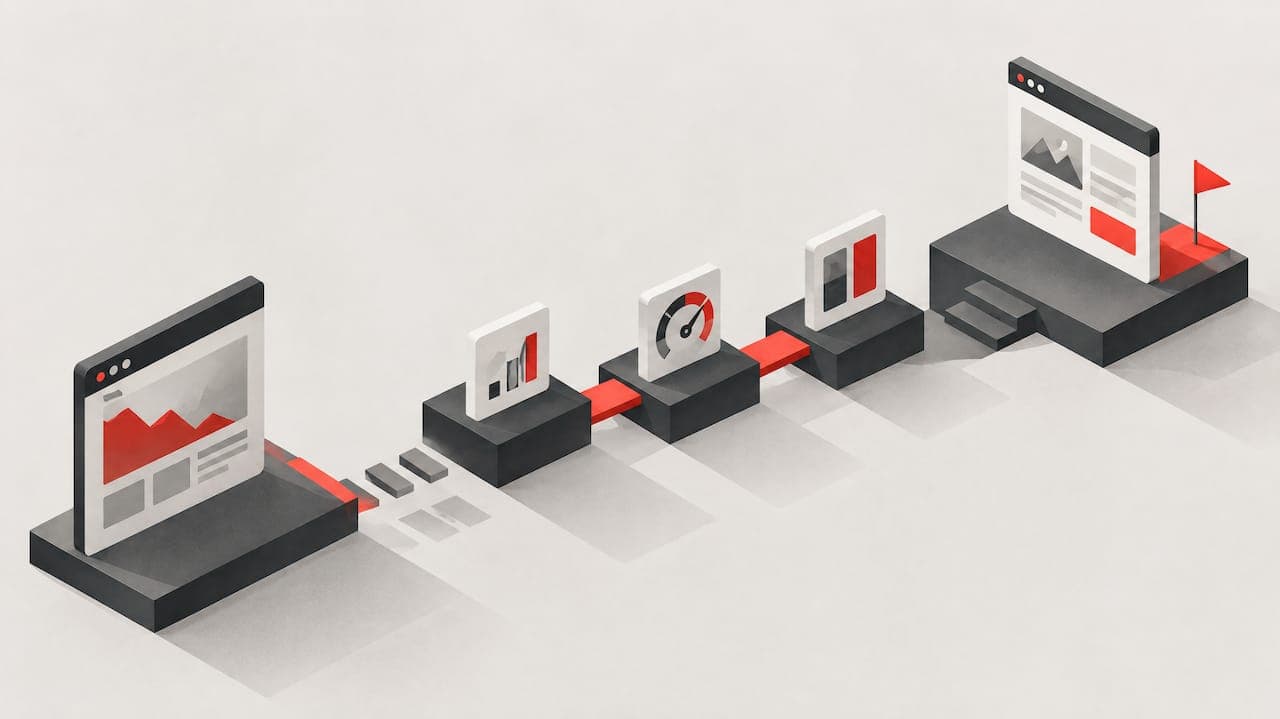
To reduce bounce rate, fix your measurement first, then your performance, then your message. Set up GA4's engaged-session tracking correctly, address Core Web Vitals issues like slow LCP and INP, sharpen your headline and call to action, align traffic sources with landing page content, and validate every change with a test before rolling it out sitewide.
TL;DR:
- Ensuring accurate engagement tracking in GA4 is crucial, as its definition differs from Universal Analytics and can mislead bounce rate interpretation.
- Addressing Core Web Vitals and page load times, especially reducing load to under 2.5 seconds for LCP, significantly decreases bounce probability.
- Optimizing headlines, call-to-action clarity, and limiting pop-ups improve immediate visitor understanding and increase chances of continued engagement.
- Prioritizing mobile responsiveness and fixing mobile-specific performance issues prevent disproportionately high mobile bounce rates.
- Running targeted A/B tests on page elements and using AI-driven audits help identify high-impact, data-backed improvements efficiently.
Table of Contents
- Measure first: GA4, diagnostics, and benchmarks
- Fix technical causes: Core Web Vitals and performance optimizations
- Content and UX: headlines, CTAs, forms, pop-ups, and encouraging the second click
- Test and validate: an experiment-first CRO framework
- Quick wins checklist: prioritized fixes you can do this week
- Save Your App: how a prioritized audit accelerates improvements
- Impact of mobile optimization and responsive design on bounce rate
- Role of page load speed beyond Core Web Vitals, including server response and caching
- Effect of internal linking and navigation structure on user engagement
- Importance of personalized content and dynamic elements to reduce bounce
- Use of analytics segmentation to identify high-bounce user groups
- Strategies for improving first-time visitor experience vs return visitors
- Author perspective: prioritization rules from the field
- Get a prioritized plan instead of guessing where to start
- Sources
- FAQ
Measure first: GA4, diagnostics, and benchmarks
Before changing anything, confirm what your numbers actually mean. GA4 defines an engaged session as one that lasts at least 10 seconds, includes at least one key event, or produces two or more page or screen views. A session that misses all three counts as a bounce. That is a different math than Universal Analytics used, so a bounce rate drop right after migrating to GA4 often just reflects the new definition, not a real behavior change. Comparing GA4 and UA bounce rates directly will mislead you.
Once tracking is trustworthy, diagnose the problem at the segment level rather than the site level. Pull GA4's Engagement reports and build an Exploration that filters by landing page, channel, and device to find where engagement actually breaks down.
- Check whether specific landing pages show unusually low engaged-session rates compared to the site average.
- Compare mobile versus desktop engagement, since problems often concentrate on one device type.
- Review channel-level data since paid social, display, and organic search tend to bring very different intent levels.
- Confirm your key events are firing correctly. A missing event tag can make an engaged visitor look like a bounce.
GA4's engagement rate is simply the inverse of bounce rate, and Google's own guidance recommends using reports and explorations to isolate low engagement by channel, landing page, or tagging problems rather than treating the site-wide figure as diagnostic on its own. Map your micro-conversions (a video play, a scroll past the fold, an add to cart) to key events so the metric reflects genuine interest, not just a long dwell time from someone who left a tab open.
What counts as "good" varies by page type. A blog post can carry a higher bounce rate than a pricing page and still be healthy, since a reader who finishes an article and leaves is not necessarily disengaged. Treat benchmarks as a directional check per page type, not a universal pass or fail line.
Fix technical causes: Core Web Vitals and performance optimizations
Speed is one of the most measurable levers you have, and the data on it is blunt. Bounce probability rises 32% as load time goes from one second to three seconds, and at five seconds the bounce probability climbs to around 90%. Every additional second of delay is visitors leaving before they ever see your content.
Bounce probability climbs sharply with load time, and the jump from a three-second load to a five-second one is where most sites lose the majority of their impatient visitors, according to Dotcom-Monitor's analysis.
Google's Core Web Vitals thresholds give you concrete targets, measured at the 75th percentile of real-user page loads to avoid a handful of outliers skewing your read:
- Largest Contentful Paint (LCP) should be 2.5 seconds or less, marking when the main content has visibly loaded.
- Interaction to Next Paint (INP) should be 200 milliseconds or less, measuring how quickly the page responds to a click or tap.
- Cumulative Layout Shift (CLS) should be 0.1 or less, capturing how much content jumps around as the page loads.
To improve INP specifically, web.dev's guidance recommends breaking up long main-thread tasks, yielding to the browser between chunks of work, minimizing DOM size, and using content-visibility to defer rendering of off-screen elements. For LCP and overall load time, compress and resize hero images, defer noncritical JavaScript, preconnect to third-party domains you actually need, and cache aggressively at the server and CDN level.
Triage by impact versus effort: fix the hero image and render-blocking scripts first since they are cheap and high-impact, then move to DOM restructuring and long-task splitting, which take longer but pay off on interaction-heavy pages. Use lab tools like Lighthouse for quick before-and-after checks during development, and rely on field data (CrUX, web.dev's Vitals recommendations) to confirm real users are actually experiencing the improvement.
Content and UX: headlines, CTAs, forms, pop-ups, and encouraging the second click
A visitor decides whether to stay within seconds, and that decision hinges on whether your page immediately answers "what is this and what do I do next." If the headline is vague or the primary action is buried below a wall of text, you lose people who would have converted if the path had been obvious.
- Put one clear value proposition and one primary call to action above the fold, and resist the urge to compete with a second offer in the same space.
- Make the CTA itself unambiguous: a button that says "Start your free scan" outperforms one that says "Learn more."
- Cut form fields down to the minimum needed to move the visitor forward; every extra field is a reason to abandon.
- Limit pop-ups to one per session, exclude them from mobile entirely where screen space is tight, and always give an obvious, one-tap way to close them.
- Use progressive disclosure so dense information (pricing tiers, technical specs) expands on demand instead of front-loading the whole page.
- Add internal links to a logical next page (a related guide, a deeper product page) so an engaged reader has somewhere to go besides the back button.
A UX-focused analysis of dashboard design makes a related point worth borrowing for any page: more data or more options on screen does not help a visitor if it is not clear which one matters. The same logic applies to your landing pages. One clear next step beats five competing ones.
Pro Tip: Test your headline and CTA changes one at a time. Changing both simultaneously means you will not know which one moved the needle.
Test and validate: an experiment-first CRO framework
Every change above is a hypothesis until you measure it. Run changes as structured tests, not permanent edits made on instinct.
- Pick one variable to change (headline, CTA color, form length) and define success as an increase in engaged sessions or a specific micro-conversion, not raw pageviews.
- Choose the right test type: an A/B test for a single page change, a multivariate test when you need to isolate several small elements, or a redirect test when comparing two entirely different page designs.
- Prioritize your highest-traffic pages first so you reach a reliable sample size in a reasonable window, rather than testing low-traffic pages that take months to resolve.
- Map your test's success event to GA4's engaged-session criteria, as Google's own guidance recommends, so the experiment actually moves the metric you care about rather than a vanity number.
- Layer in qualitative tools like session replay or short user interviews when a quantitative test shows a result but does not explain the "why" behind it.
Quick wins checklist: prioritized fixes you can do this week
- Compress your hero image and confirm it loads under the LCP threshold.
- Exclude pop-ups from mobile sessions and cap desktop pop-ups to once per visit.
- Move your primary CTA above the fold if it currently requires scrolling.
- Remove or defer any script blocking initial render that is not essential to the page.
Over the next one to four weeks, lazy-load below-the-fold media, audit and cut third-party tags you no longer need, and add event tracking for the micro-conversions you are missing.
Pro Tip: Run a 14-day before-and-after comparison of engaged sessions on the specific pages you changed, not the site average, so seasonal traffic shifts do not mask your result.
Save Your App: how a prioritized audit accelerates improvements
Running every diagnostic and fix above takes time most teams do not have spare. A platform combining AI-driven diagnostics with human beta tester reviews across multiple audit layers, including technical SEO, performance, UX and navigation, conversion, accessibility, trust and security, and onboarding.
- Ranked fixes mean you address the highest-impact issue first instead of guessing where to start.
- A combined AI and human review catches friction points that automated scans alone tend to miss, such as confusing onboarding steps.
- A delivered audit gives you a prioritized dashboard you can hand directly to a developer or designer.
Impact of mobile optimization and responsive design on bounce rate
Mobile visitors abandon slow or awkward pages faster than desktop visitors, since they typically arrive with less patience and a smaller screen to work with. A page that renders fine on a laptop but forces pinch-to-zoom, hides the CTA below three screens of scrolling, or triggers a full-screen pop-up on load will lose mobile traffic disproportionately.
Responsive design solves the layout half of this problem: text, images, and buttons resize to fit the viewport instead of forcing the visitor to fight the page. But responsive layout alone does not fix performance. A mobile connection is often slower and less stable than a desktop one, which means the Core Web Vitals thresholds matter even more on mobile, since the same 2.5-second LCP target is harder to hit on a phone loading over cellular data.
Check your GA4 Engagement reports segmented by device category before assuming mobile is the problem. Sometimes it is a specific page template, not the platform, causing the gap. Common culprits include tap targets placed too close together, forms that do not trigger the correct mobile keyboard (a numeric keypad for a phone number field, for instance), and pop-ups sized for desktop that cover the entire mobile viewport with no visible close button.
Fixing mobile bounce usually means treating it as its own design pass rather than an afterthought to the desktop layout. Test your primary conversion path on an actual mid-range phone, not just a resized browser window, since emulators tend to understate real-world load times and rendering quirks.

Role of page load speed beyond Core Web Vitals, including server response and caching
Core Web Vitals measure what the browser renders, but a slow server response can sink every one of those metrics before the browser even gets a chance to paint anything. Time to First Byte, the delay before your server sends the first piece of a response, sets the floor for how fast LCP can possibly be. No amount of front-end optimization fixes a backend that takes two seconds to respond.
Caching is the most direct lever here. A CDN that serves static assets (images, CSS, JavaScript) from a location physically close to the visitor cuts transfer time regardless of how efficient your code is. Server-side caching of dynamically generated pages, such as a cached version of a product page that does not need to be rebuilt on every request, removes database query time from the critical path entirely.
Database query efficiency matters just as much on high-traffic pages. A page that runs a dozen unoptimized queries to assemble a single view will bottleneck under load even if it renders quickly during low-traffic testing. Compressing responses with gzip or Brotli, minimizing redirect chains, and using HTTP/2 or HTTP/3 to allow parallel asset loading all reduce the time between a visitor's click and the first pixel appearing.
None of this shows up directly in a Core Web Vitals report, but it shapes every metric that does. A practical guide to Core Web Vitals covers these same optimization tactics in more technical depth for teams ready to hand a checklist to a developer.
Effect of internal linking and navigation structure on user engagement
A visitor who lands on one page and immediately sees a relevant next step is far less likely to leave than one who hits a dead end. Internal links do double duty: they help search engines understand your site structure, and they give an engaged reader somewhere to go besides the back button.
Navigation structure sets the ceiling for this. A menu with a dozen top-level items and no clear hierarchy forces visitors to guess where to click, while a navigation built around the three or four things visitors actually come for keeps the path obvious. Breadcrumbs help on deeper pages by showing visitors where they are and giving them an easy way to step back a level instead of exiting entirely.
Contextual internal links, placed inside the body copy rather than only in a sidebar or footer, tend to get more engagement because they appear exactly where a reader's interest is already active. A blog post that links to a relevant deeper guide partway through the article, rather than only at the very end, gives an engaged reader a natural branch point.
Related content modules ("you might also like" sections) work best when the recommendations are genuinely relevant to the page a visitor is already on, not generic popular-posts widgets. A mismatch here (showing an unrelated article) undermines the same trust you are trying to build with a clear headline and CTA. Treat internal linking as part of your conversion path, not just an SEO afterthought.
Importance of personalized content and dynamic elements to reduce bounce
Generic pages that show the same content to every visitor regardless of where they came from or what they searched for leave engagement on the table. A returning visitor who already knows your product does not need the same introductory copy a first-time visitor does, and showing it anyway wastes their attention.
Dynamic elements based on acquisition source are one of the more direct applications of this. A visitor who clicked a search ad for a specific feature can see a headline referencing that feature rather than a generic homepage message, closing the message match gap discussed earlier in a more automated way. Similarly, geographic personalization (showing local pricing, local availability, or regional examples) can make a page feel relevant instead of generic.
Dynamic content does carry a performance cost if implemented poorly, since client-side personalization scripts can delay rendering and hurt the same Core Web Vitals scores you worked to fix. Server-side personalization, where the correct version of the page is assembled before it reaches the browser, avoids this tradeoff but requires more backend work to set up.
Start small: personalize the headline or hero section based on traffic source before attempting full dynamic page rebuilding. Measure the engaged-session rate for personalized versus generic variants using the same testing framework covered earlier, since personalization that does not measurably improve engagement is just added complexity.
Use of analytics segmentation to identify high-bounce user groups
A single site-wide bounce rate hides more than it reveals. Segmentation breaks that number apart so you can see exactly which visitors are leaving and why, rather than guessing at a sitewide fix.
Start with the segments most likely to show real variation: device category, traffic source, landing page, geography, and new versus returning visitor status. A GA4 Exploration report lets you cross two or three of these dimensions at once, for example landing page by device, to spot a specific combination (a mobile visitor on your pricing page) that bounces far more than the average.

Once you find a high-bounce segment, check whether the cause is something covered earlier in this guide: a slow-loading page for that specific device, a message mismatch for that specific traffic source, or a confusing layout for that specific landing page. Segmentation does not fix anything on its own, but it tells you exactly where to spend your fixing effort instead of applying changes sitewide and hoping.
Revisit your segments periodically rather than treating this as a one-time audit. Traffic mix shifts, a new campaign can introduce a fresh high-bounce segment, and a page that performed well for months can degrade after a content or design change elsewhere on the site.
Strategies for improving first-time visitor experience vs return visitors
First-time visitors and returning visitors need almost opposite treatment. A first-time visitor has no context: they need the value proposition spelled out clearly, trust signals visible, and a low-commitment next step. A returning visitor already has that context and is often looking for something specific, like a login link, a pricing update, or a feature they remember seeing.
For first-time visitors, keep the above-the-fold experience focused on answering "what is this and why should I care" without assuming any prior familiarity with your product or industry jargon. Trust signals (customer counts, recognizable logos, simple guarantees) do more work here than they do for a returning visitor who has already decided to trust you enough to come back.
For returning visitors, consider surfacing a more direct path, such as a "welcome back" state that skips the introductory pitch and goes straight to a dashboard link, a saved cart, or the specific page they visited last. This is a subset of the personalization approach covered earlier, applied specifically to visit recency rather than acquisition source.
Segment your GA4 reports by new versus returning to confirm the two groups actually behave differently on your site before investing in separate experiences. Some sites see little difference and can skip this optimization in favor of higher-impact fixes elsewhere. Others see a stark gap, particularly on pages tied to an account or a multi-visit purchase decision, which makes the separate-experience investment worth prioritizing.
Author perspective: prioritization rules from the field
Measure correctly, fix performance, align traffic, then test. Quick fixes handle the obvious problems; commission a full audit once diagnostics stop telling you where to look next.
— William
Get a prioritized plan instead of guessing where to start
Working through every diagnostic in this guide by hand takes real time, and most teams have neither the spare hours nor a developer waiting on standby. Save Your App runs the AI and human review process for you and hands back a ranked list of fixes, so you spend your time acting instead of auditing.
- Start with a free scan on the product page to see where your own site loses visitors.
- Compare the Free, Solo, and Founder plans, along with the Extra 3-day tests option, on the pricing page.
- Use the ranked fixes to prioritize your own developer time on the changes most likely to move engaged sessions.
Sources
Sometimes the page is fine and the traffic is wrong. A visitor who clicks a search ad for "free project management software" and lands on a page promoting an enterprise-only paid tier will bounce regardless of how well the page is designed, because the message they were promised does not match what they found.
- How website speed affects SEO and user behavior | Dotcom-Monitor
- Understanding GA4 differences vs Universal Analytics | Data Community (govuk analysis)
- Web
- GA4: Engagement rate and bounce rate - Analytics Help
Neil Patel's guidance on this echoes the same principle: identify which pages and traffic segments are actually losing visitors before making sitewide changes, since blanket "best practice" edits tend to underperform targeted, data-driven fixes.
FAQ
Is a 90% bounce rate bad?
A 90% bounce rate is high for most page types, especially a product or pricing page where you expect visitors to explore further. Context matters though: a single-page blog post or a page designed for a quick answer can carry a high bounce rate and still be healthy, since the visitor got what they came for and left satisfied.
What causes a high bounce rate?
The most common causes are slow page load, particularly a poor LCP or INP score, a mismatch between what an ad or search result promised and what the page delivers, and a confusing layout that buries the headline or call to action. Intrusive pop-ups and broken mobile layouts add to all three.
What does bounce rate mean?
Bounce rate is the percentage of sessions that leave without meeting the engagement criteria your analytics platform tracks. In GA4 specifically, a session counts as engaged, and therefore not a bounce, if it lasts at least 10 seconds, includes a key event, or generates two or more page views.
Do you want your bounce rate to be high or low?
A lower bounce rate generally signals more visitors are engaging with your content instead of leaving immediately, so lower is usually the goal. The right target still depends on page type, since an informational page answering one question naturally sees more one-and-done visits than a multi-step signup flow.
Why is my bounce rate suddenly high after switching to GA4?
Switching platforms often changes the number itself even when visitor behavior has not changed, because GA4 calculates engagement differently than Universal Analytics did. Avoid comparing the two numbers directly and instead track GA4's engagement rate going forward as your consistent baseline.