

Conversion funnel analysis identifies exactly where users abandon a defined journey so you can prioritize the fixes that increase conversions and protect revenue. It works by breaking the journey into measurable steps, the same approach Shopify and Amplitude document in their own playbooks. Done right, it turns a vague "signups are down" complaint into a specific, testable hypothesis about one broken step.
TL;DR:
- Funnel analysis provides detailed insight into which specific step causes the most user drop-off, helping prioritize targeted fixes over broad changes.
- Segmenting data by device, traffic source, or user type reveals whether issues are UX, messaging, or targeting related, guiding precise improvements.
- Combining quantitative metrics with session replays and heatmaps uncovers the true user experience issues behind drop-offs.
- Testing fixes with a disciplined, one-variable approach ensures resources focus on high-impact, low-effort changes that yield measurable results.
- Automated diagnostic tools paired with human review can significantly reduce analysis time from weeks to days, enabling faster iterative improvements.
Table of Contents
- What Conversion Funnel Analysis Is and Why It Matters
- Funnel Stages and the Core Metrics to Track
- How to Run a Step-By-Step Conversion Funnel Analysis
- Segmentation and Cohort Analysis: Which Slices Reveal the Truth
- Diagnosing Drop-Offs With Data and Direct Observation
- Prioritizing Fixes and Validating Them With Testing
- How AI Diagnostics Plus Human Review Speed Up the Process
- A Working Checklist for Your First Funnel Sprint
- Get a Faster Read on Your Own Funnel
- Sources
- FAQ
What Conversion Funnel Analysis Is and Why It Matters
A conversion funnel maps every step a person takes between first contact and the outcome you want, whether that's a purchase, a signup, or an activated account. A sales funnel tracks leads through a pipeline; a marketing funnel tracks campaign traffic toward a conversion event; a product funnel tracks in-app behavior toward activation or retention. They overlap but answer different questions, and mixing them up is how teams end up optimizing the wrong metric.
The real payoff shows up on the business side. Funnel analysis lowers customer acquisition cost by fixing leaks instead of just buying more traffic, raises activation rates by exposing onboarding friction early, and protects revenue that would otherwise disappear silently at checkout or signup.
It deserves priority over a random experiment backlog whenever:
- Traffic is growing but conversion isn't following
- You suspect one specific step (checkout, onboarding, pricing) is bleeding users
- Paid acquisition costs are climbing faster than revenue per user
- Leadership needs a clear before/after story to justify a roadmap investment
Funnel Stages and the Core Metrics to Track
Ecommerce funnels typically run product view, add to cart, checkout start, payment, and confirmation. SaaS funnels usually run visit, signup, activation event, and paid conversion. Pick stages that reflect genuine intent shifts, not just page views. Two or three thin steps beat ten arbitrary ones.
Once stages are set, five metrics make a funnel report diagnostic rather than decorative:
- Entrants per stage: raw count entering each step
- Step-to-step conversion rate: percentage moving from one stage to the next
- Drop-off rate: the inverse, showing exactly where people quit
- Cumulative conversion: percentage of original entrants who reach the final stage
- Time-to-convert and CAC/CPA: how long conversion takes and what it costs per acquired customer
Statistic Callout: Average ecommerce conversion sits around 1.4%, while the top 20% of stores clear 3.2% or higher, according to Shopify's analysis. Treat that gap as a reason to build your own historical baseline rather than chasing an industry-wide number that ignores your traffic mix, price point, and channel makeup.
How to Run a Step-By-Step Conversion Funnel Analysis
A funnel analysis only produces action when it follows a consistent sequence. Skipping steps is how teams end up debating opinions instead of evidence.
- Map the critical journey into four to six steps that represent real intent changes, not arbitrary page loads.
- Instrument every event with consistent naming conventions, relevant properties like device and traffic source, and server-side confirmation for anything revenue-critical, following the approach Zoho PageSense recommends for avoiding measurement gaps.
- Find the largest proportional drop-off first, then immediately segment it. The biggest leak in raw numbers isn't always the most fixable one.
- Pair the numbers with qualitative signals. Session replay and on-page behavior explain the "why" behind a metric that only shows the "what."
- Form a specific hypothesis and test it. "Checkout drops 40% on mobile because the payment field truncates" is testable. "Checkout is bad" is not.
This cycle repeats. Amplitude's documentation on pairing funnel reports with experimentation makes the same point: insight without a test attached rarely survives contact with the next planning meeting.
Segmentation and Cohort Analysis: Which Slices Reveal the Truth
A blended funnel number hides more than it reveals. Segmenting by device, traffic source, campaign, geography, and new versus returning users is what turns a flat conversion rate into a diagnosis, a point Mixpanel's funnel guide makes repeatedly in its own case work.
The segments worth running first:
- Device: mobile drop-offs often point to layout or form friction, not price objections
- Traffic source: a paid campaign converting poorly usually signals audience mismatch, not product failure
- Campaign and landing page: mismatched messaging between ad and page kills intent before the funnel even starts
- New vs. returning users: returning users dropping at the same step as new ones suggests a structural problem, not a first-time confusion issue
A mobile-specific drop and a paid-campaign-specific drop point to entirely different fixes. One is a UX problem; the other is a targeting or messaging problem, and treating them the same wastes a sprint.
Pro Tip: Define your conversion window before you segment anything. A 7-day window and a 30-day window can produce wildly different cohort conversion rates for the same underlying behavior, and comparing across mismatched windows will send you chasing a fake trend.
Diagnosing Drop-Offs With Data and Direct Observation
Numbers tell you where. Watching real sessions tells you why. Combining both, as Amplitude recommends, is what separates a funnel report from an actual fix.
- Watch session replays and heatmaps at the exact step where drop-off spikes to catch rage clicks, ignored CTAs, or confusing form layouts.
- Audit form analytics for fields where users pause, backtrack, or abandon entirely.
- Rule out measurement errors first: duplicate event fires, broken cross-domain tracking, and silent payment gateway failures often masquerade as UX problems, a trap Shopify's own funnel guidance warns against.
- Ship quick wins once a real cause is confirmed: shorten long forms, add a progress indicator, offer guest checkout, and make pricing visible before the final step instead of hiding it behind a click.
Prioritizing Fixes and Validating Them With Testing
Not every fix deserves equal attention, and testing them without discipline wastes the traffic you have. A simple impact times ease or PIE score (potential, importance, ease) ranks your fix list so the highest-leverage, lowest-effort changes go first.
Testing rules worth enforcing on every experiment:
- Change one variable per test, never a full page redesign at once
- Calculate the sample size needed for statistical significance before launching, not after
- Set a guardrail metric (like average order value) so a lift in one number doesn't mask a loss elsewhere
Expect the bottleneck to move. Shopify's own funnel research notes that fixing one stage frequently just shifts pressure downstream to the next one, so plan for iterative cycles rather than a single decisive fix.
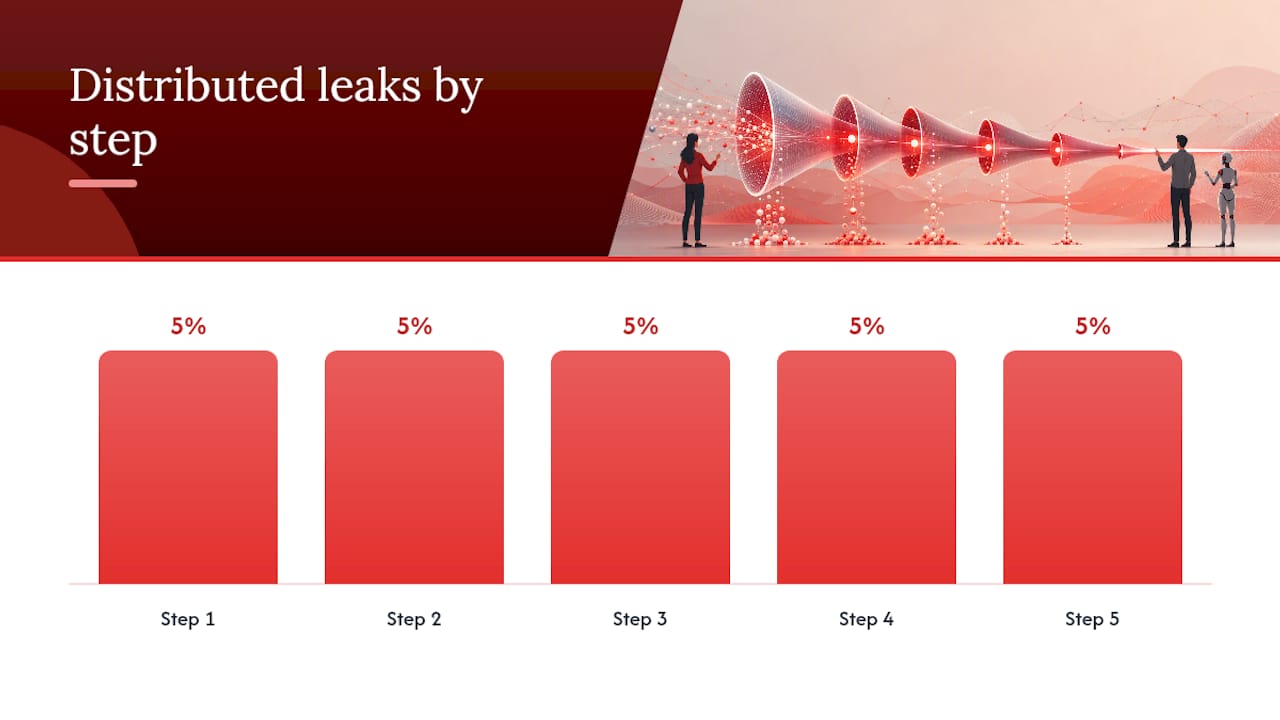
Pro Tip: Distributed friction, small drop-offs at five different steps, compounds into a bigger loss than one dramatic single-step failure. Don't ignore the "boring" 5% leaks just because no single one looks alarming on its own.
How AI Diagnostics Plus Human Review Speed Up the Process
Manual funnel audits take weeks of pulling reports, watching replays, and cross-referencing segments by hand. A specialized engine automates the first pass, scanning a page across seven audit layers, including conversion and onboarding, to flag pricing confusion, broken signup flows, and friction points automatically.
What separates this from a purely automated scan is the second layer: human beta testers reviewing the same flow and adding context that pattern detection alone tends to miss, like a pricing table that's technically clear but psychologically confusing.
The output that matters most for prioritization:
- Ranked issue lists ordered by likely impact, not just by what a script happened to catch
- Actionable fix prompts tied to each ranked issue rather than a generic audit summary
- PDF reports and trend tracking so teams can measure whether a fix actually moved the metric
For teams without a dedicated analytics engineer, that combination shortens diagnosis from weeks to days.
A Working Checklist for Your First Funnel Sprint
Run this as a one-week sprint, not a quarterly project: map your funnel stages, audit event instrumentation for gaps, pull the last 30 to 90 days of stage-level data, segment by device and source, watch ten to fifteen session replays at your worst-performing step, then draft two testable hypotheses.
Review your primary funnel every two to eight weeks depending on traffic volume. High-traffic products can validate tests in two weeks; lower-traffic B2B funnels often need the full eight to reach a meaningful sample. What consistently gets missed isn't the analysis itself. It's the discipline to re-run this checklist on a schedule instead of treating funnel review as a one-time cleanup after a bad quarter.
— William
Get a Faster Read on Your Own Funnel
Most teams lose days pulling reports, watching replays, and debating which drop-off matters most before a single fix ships. This tool compresses that timeline by running a page through seven audit layers, Technical SEO, Performance, UX & Navigation, Conversion, Accessibility, Trust & Security, and Onboarding, combining AI diagnostics with human beta tester review in every paid plan, then returning a ranked list of fixes instead of a raw data dump.
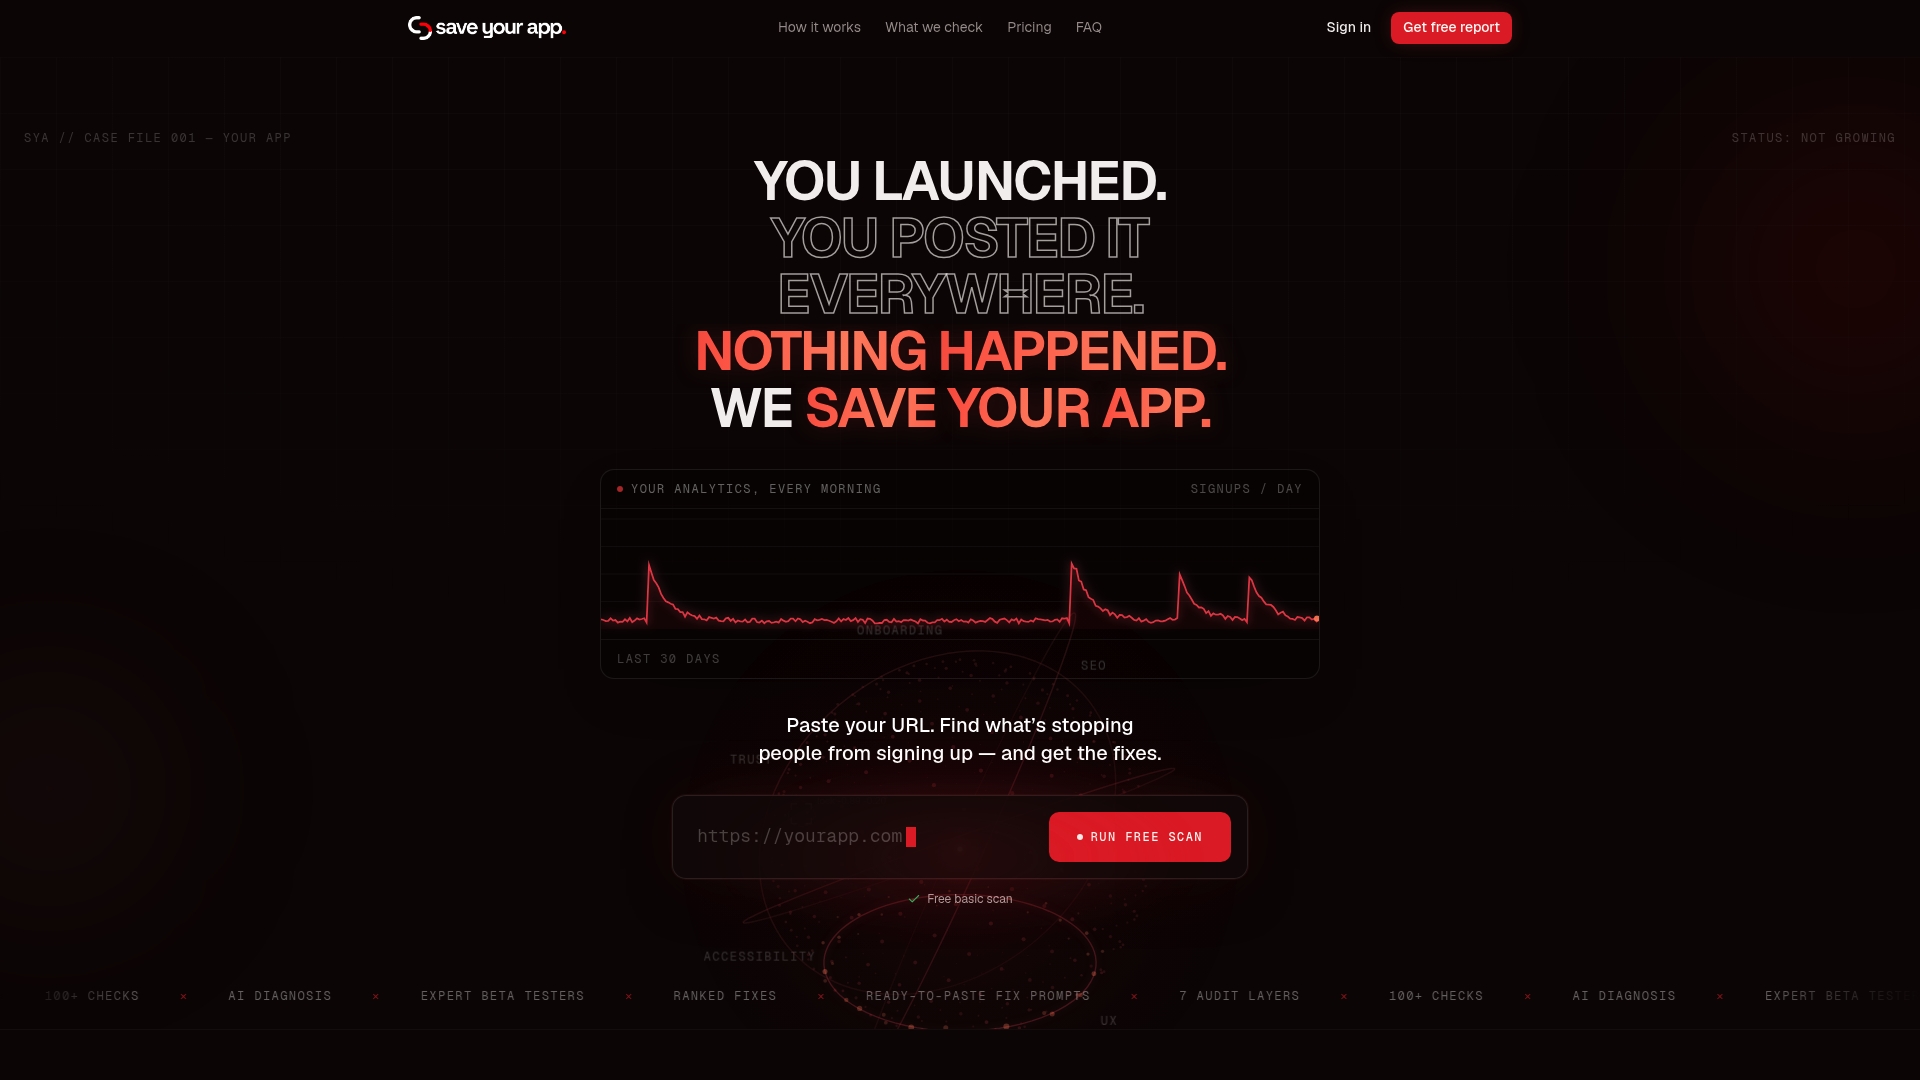
This fits best for teams that already suspect a specific stage is leaking users, whether that's a confusing pricing page or a stalled onboarding flow, and want a second, structured opinion before committing engineering time to a fix. The Free plan gets you a baseline scan with no cost. If you want the full seven-layer audit with human review, the Solo plan runs $49 per month, and the Founder plan runs $129 per month for teams that want ongoing tracking across releases. Run your page through Saveyourapp and see which fix should actually come first.
Sources
- Conversion funnel analysis — Shopify
- What Is Funnel Analysis? Definition, examples, and tools — Amplitude
- Introduction to analytics funnel analysis — Mixpanel
- Funnel Analysis Guide — Zoho PageSense
FAQ
What Are the Steps in the Conversion Funnel?
Most funnels run through awareness, consideration, conversion, and retention, though ecommerce and SaaS teams typically break these into more granular steps like product view, cart, checkout, and confirmation.
How Do You Calculate Funnel Conversion?
Divide the number of users who complete a stage by the number who entered it to get the stage-to-stage conversion rate; cumulative conversion divides final-stage completions by total entrants at the top.
What Are the Four Stages of Conversion?
The four commonly cited stages are awareness, consideration, conversion, and retention, though the exact labels and step count vary by business model and should reflect real shifts in user intent.
What Is the Funnel Analysis Method?
Funnel analysis maps a journey into stages, tracks entrants and drop-off at each one, then combines that data with segmentation and qualitative tools like session replay to identify and prioritize fixes, an approach both Shopify and Saveyourapp's audit layers apply in practice.
How Often Should You Review a Conversion Funnel?
Review your primary funnel every two to eight weeks depending on traffic volume, with high-traffic products validating tests faster than lower-volume B2B funnels that need more time to reach a reliable sample.