

A conversion audit is a systematic review of your website's funnel that produces a prioritized list of fixes you can test to improve conversion rates. It combines quantitative data like drop-off points and funnel completion rates with qualitative evidence from real users to explain why people leave. The output is not a revenue increase by itself: it is a ranked backlog that marketers, ecommerce managers, and product owners can turn into testable changes.
TL;DR:
- Prioritizing issues based on impact, effort, and confidence ensures you focus on high-value fixes that are most likely to improve conversion rates effectively.
- Instrumenting reliable GA4 ecommerce events and conducting qualitative research like usability Sessions are essential for accurately identifying drop-off causes and forming actionable hypotheses.
- Addressing website performance, especially Core Web Vitals, can significantly boost conversion rates and revenue, with measurable impacts documented in case studies.
- Running structured, staged A/B tests with predetermined sample sizes and durations prevents misleading results and supports data-driven decision-making.
- Using AI-driven diagnostics combined with human review enables quicker, more targeted audits, turning reports into effective testing backlogs.
Table of Contents
- What does a conversion audit actually examine?
- Why run a conversion audit at all?
- A step-by-step framework for running a conversion audit
- How to prioritize findings and write testable hypotheses
- Running the experiment without wasting the traffic
- Why site performance shapes your conversion rate
- How Save Your App applies this framework in practice
- Making audits a habit, not a one-time report
- Getting an audit done without the guesswork
- Sources
- FAQ
What does a conversion audit actually examine?
A conversion audit looks at every layer that could stop a visitor from becoming a customer: analytics data, user experience and navigation, technical performance, onboarding flow, and trust or security signals. Each layer answers a different question. Analytics tells you where people drop off. UX research tells you why. Technical audits tell you whether speed or bugs are quietly costing you conversions before a user even sees your offer.
A few terms come up constantly in this work, and getting them straight avoids confusion later. A baseline metric is the conversion rate or funnel completion number you measure before making any change, the number every test result gets compared against. A conversion point is the specific action you're optimizing for, a purchase, a signup, a demo request. A funnel step is one stage in the sequence a user moves through to reach that conversion point. A hypothesis is a testable statement predicting that a specific change will move a specific metric by a specific amount.
Not every audit needs to cover all five layers at once. A full audit makes sense when conversion rates have stagnated, when you're redesigning a core flow, or on a recurring schedule to catch regressions. A targeted check, focused on just checkout or just onboarding, fits better when you already know where the problem lives and just need the qualitative detail to fix it.
Full audits and targeted checks share the same underlying process:
- Full audits cover analytics, UX, technical performance, onboarding, and trust signals across the entire funnel.
- Targeted checks zoom into one funnel step, like checkout abandonment or mobile navigation.
- Both rely on the same baseline metrics and hypothesis format to stay comparable over time.
Why run a conversion audit at all?
An audit's real value is turning scattered guesses into a ranked list of opportunities, not delivering an instant lift. Baymard's research on conversion audits makes this distinction directly: an audit produces a prioritized to-do list, and the actual conversion gains come from testing and implementing the items on that list.
That distinction matters for how you set expectations internally. Treating the audit as the finish line is the single most common way teams waste the work: they commission a report, read it once, and never build the backlog into a testing calendar.
A conversion audit's payoff is risk reduction, not certainty. By ranking issues before you build anything, you spend engineering time on the changes most likely to move the needle instead of whatever the loudest stakeholder wants fixed first.
Setting success criteria before you start protects you from moving goalposts later. Pick your baseline metric (checkout completion rate, signup conversion, add-to-cart rate), record its current value, and define what percentage lift would count as a win before you run a single test.
A step-by-step framework for running a conversion audit
Running an audit well means following a sequence where each step feeds the next. Skipping instrumentation to jump straight to qualitative research, or skipping prioritization to jump straight to testing, is how audits produce noise instead of a usable backlog.
- Define objectives and conversion points. Tie the audit to a business metric that matters, revenue per visitor, signup rate, or checkout completion, and name the exact conversion points you're measuring.
- Inventory your funnels and rank pages by priority. Start with bottom-of-funnel pages (checkout, pricing, signup) since fixes there tend to have the shortest path to revenue.
- Instrument your analytics reliably. Set up GA4 ecommerce events like view_item, add_to_cart, begin_checkout, and purchase, then verify the data is firing correctly before trusting any report built on it.
- Collect qualitative evidence. Run speak-aloud usability sessions, review session recordings, and send short surveys at the point of drop-off to learn why users abandon a step, not just that they abandoned it.
- Analyze drop-offs and map them to causes. Cross-reference where users leave in your funnel report with what your qualitative research surfaced: a confusing form field, a slow page, an unclear price.
- Form hypotheses with clear success metrics. Write each finding as a testable statement with a defined metric and target lift, then estimate the size of the opportunity using your baseline traffic and conversion numbers.
- Plan experiments and schedule rollout. Sequence your test backlog by expected impact and available traffic, so high-confidence, high-impact changes get tested first.
Each step produces an artifact you can point to later: an event log, a funnel report, a recording clip, a written hypothesis. That paper trail is what separates a real audit from an opinion piece about your website.
The instrumentation step deserves extra care because everything downstream depends on it. Optimize Smart's guidance on GA4 funnel exploration recommends defining funnel steps by events rather than URL patterns, since single-page apps and dynamic routing can make URL-based funnels miscount steps entirely. If your begin_checkout event fires inconsistently, every funnel report built on top of it will mislead you about where users actually drop off.
Qualitative research is where a lot of teams under-invest, partly because it feels slower than pulling a report. A five-person speak-aloud session on your checkout flow, watched carefully, often surfaces the same friction points that a hundred session recordings would eventually reveal, just faster. Surveys triggered at the exact moment of abandonment, asking a single open-ended question like "what stopped you from completing this?", tend to produce more usable answers than a general satisfaction survey sent days later.
Pro Tip: Run your qualitative research on the same page and time period as your quantitative data pull, so the two data sets describe the same slice of user behavior.
Prioritization, covered in more depth further down, is the step that turns a pile of findings into an actual plan. Without it, an audit report just becomes a longer version of the same problem: too many ideas, no order to test them in.
How to prioritize findings and write testable hypotheses
Once you have a list of findings from your analytics and usability work, the next job is ranking them so your team tests the highest-value items first. A simple impact times effort times confidence score works well for most teams: estimate how much a fix could move your target metric, how much engineering or design effort it takes, and how confident you are in the underlying data, then multiply the three into a rough score you can sort by.

For quick triage without a formal scoring session, ask three questions of each finding: does it affect a high-traffic page, does it affect a step close to the conversion point, and does the qualitative evidence back up the quantitative signal. Findings that score yes on all three jump to the top of the backlog.
Sizing the opportunity matters before you commit engineering time to a test. A fix on a page with low traffic will take longer to reach statistical significance no matter how promising the hypothesis looks, so check your baseline conversion rate and available traffic before scheduling the test.
Every finding should convert into a hypothesis with the same structure:
- Change: the specific thing you'll modify (form field, button copy, page layout).
- Expected effect: the mechanism, in plain terms, by which the change should help.
- Metric: the exact conversion point you're measuring against.
- Target lift: the minimum improvement that would count as a meaningful result.
Running the experiment without wasting the traffic
A hypothesis is only useful once it's been tested properly, and that means respecting sample size and duration before reading results. Statistical significance tells you the difference you observed probably isn't random noise, but it doesn't tell you the difference is large enough to matter for the business. A test can be statistically significant and practically irrelevant, or promising but underpowered because it ended too early.
- Set sample and duration targets before launch, based on your baseline conversion rate and current traffic, and don't peek at results to decide when to stop early.
- Roll out in stages when the change is risky, sending a small percentage of traffic first and expanding once you've confirmed nothing is broken.
- QA the experiment across devices and browsers before it goes live, since a bug in only one variant will corrupt the whole result.
- Monitor supporting metrics during the test, not just your target conversion metric, to catch a change that lifts one number while quietly hurting another.
- Document null and negative results with the same care as wins, since knowing what doesn't work narrows the next round of hypotheses.
Pro Tip: Write down what you expected to happen before the test ends, so a surprising result gets investigated instead of quietly explained away.
A negative result isn't a wasted test if you capture what you learned. The point of the whole cycle is narrowing your hypothesis space over time, and a clear "this didn't work, here's our best guess why" note does that just as well as a win does.
Why site performance shapes your conversion rate
Page speed is not a side issue to conversion, it is one of the more direct levers available once the obvious UX problems are fixed. Web documents significant conversion rate and revenue per visitor increases following Core Web Vitals-focused optimization work, a striking example of how much technical performance can move business metrics.
Core Web Vitals improvements have measured business impact in documented case studies. Rakuten 24's Core Web Vitals case study shows conversion lifts tied directly to performance work rather than to any change in the offer or the design.
The practical move is linking field-measured performance data (RUM) to your conversion events before you invest engineering time in a performance fix, so you're testing for business impact rather than chasing a better lab score. The most common technical fixes worth prioritizing are giving your largest image or hero element loading priority to improve Largest Contentful Paint, reserving space for elements that load late to reduce Cumulative Layout Shift, and tuning lazy-load thresholds so images below the fold don't block the ones users actually see first.
Once a performance fix ships, validate it the same way you'd validate any other hypothesis: through an A/B test or a monitored staged rollout, not just a before-and-after lab score comparison.

How Save Your App applies this framework in practice
A platform built its Prism Engine™ around the same seven-layer thinking this framework describes: Technical SEO, Performance, UX and Navigation, Conversion, Accessibility, Trust and Security, and Onboarding. The engine runs an automated diagnostic across all seven layers and returns a ranked list of issues rather than a flat report, which mirrors the prioritization step covered above.
This approach pairs AI-driven diagnostics with human expert reviews on paid plans, so findings that need human judgment, like whether onboarding copy is genuinely confusing or just unconventional, get a second look before they turn into a hypothesis. A practical version of the workflow looks like this: run a free scan, review the prioritized backlog it produces, turn the top items into A/B tests, measure against your baseline, and repeat the scan on a schedule to catch regressions.
Making audits a habit, not a one-time report
The biggest failure mode in this work isn't a bad audit, it's a good audit nobody acts on. Teams commission the review, admire the findings, and let the backlog go stale because no one owned turning it into a testing calendar. Baymard's guidance on conversion audits is blunt about this: an audit is meant to start a cycle of measuring, hypothesizing, testing, and implementing, not to end with a report.
Instrument before you optimize. A funnel report built on shaky event tracking will send you chasing the wrong problem, and no amount of clever hypothesis-writing fixes bad data underneath it. Validate every experiment against a real business KPI, not a proxy metric that looks good in a slide deck but doesn't move revenue.
— William
Getting an audit done without the guesswork
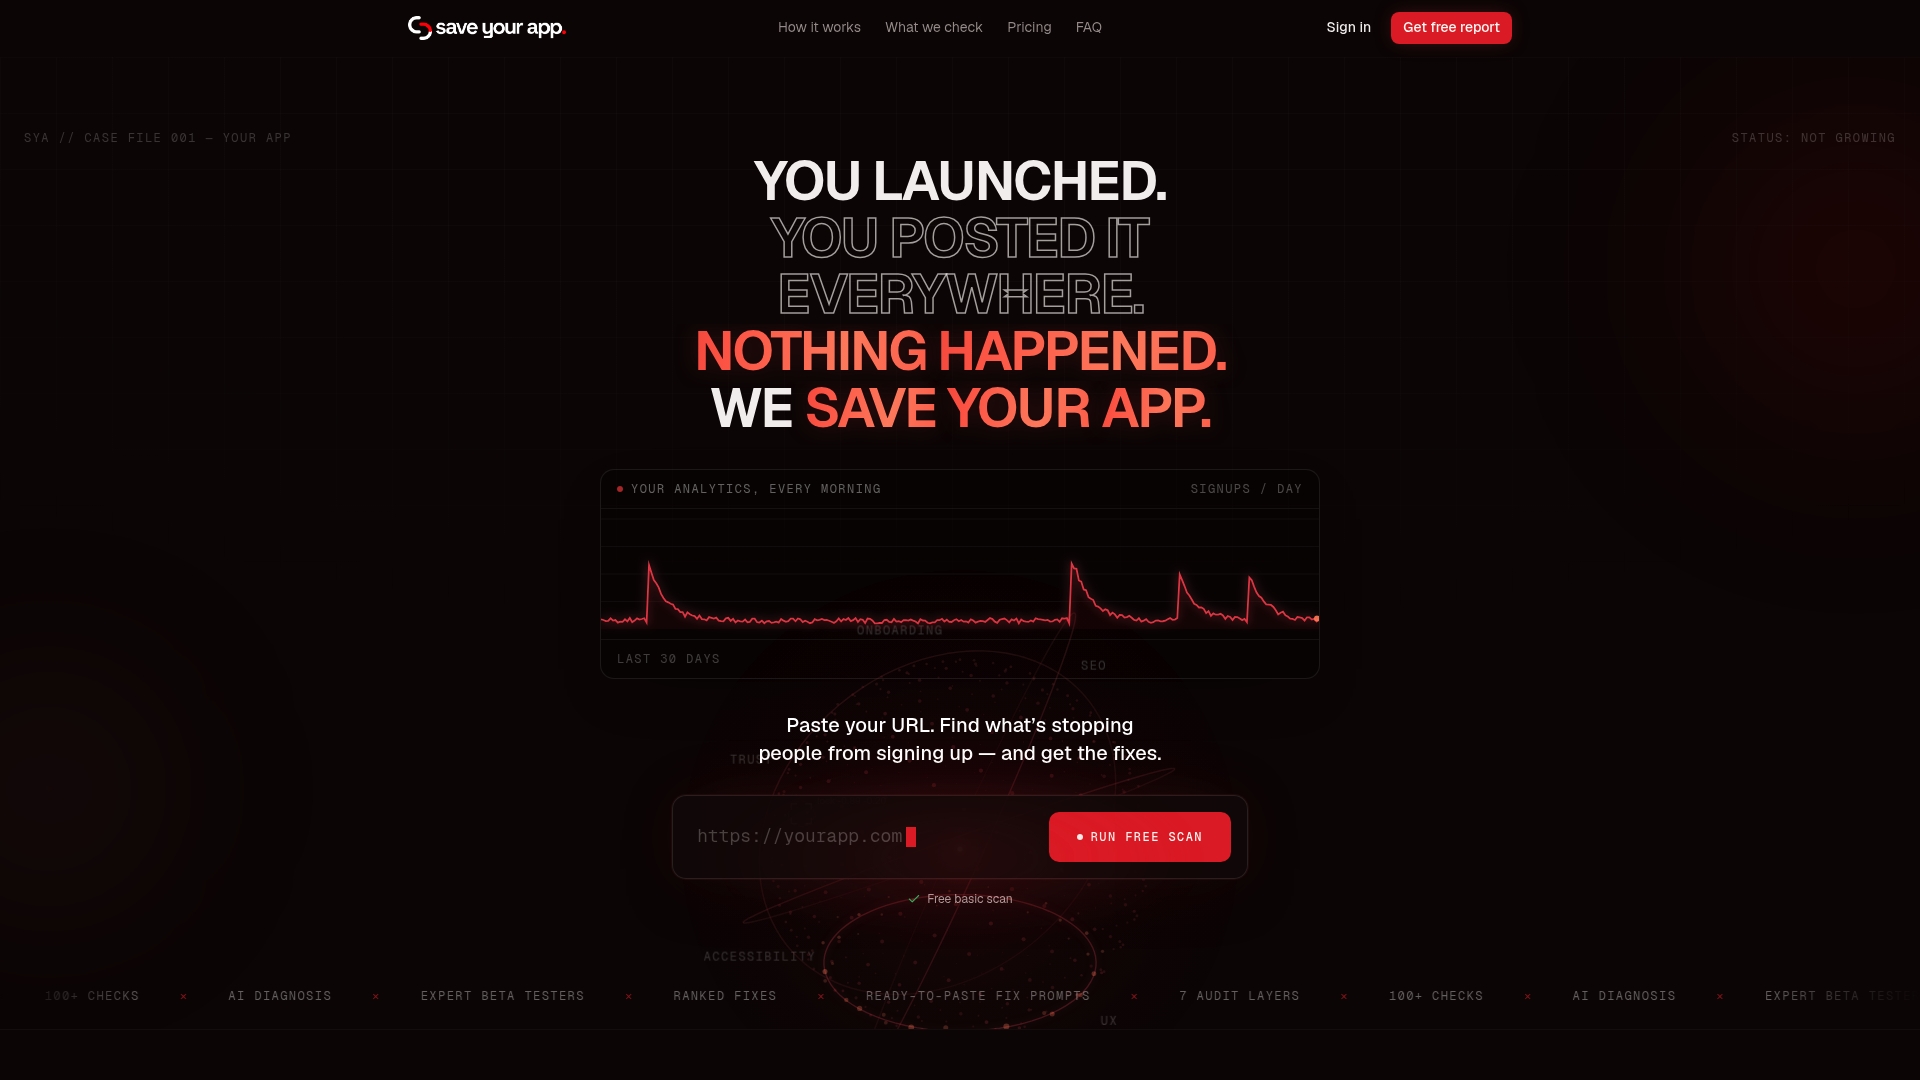
Running the full framework above by hand takes real time: instrumenting GA4 events correctly, building funnel reports, recruiting usability testers, and scoring a backlog before you've tested anything. Save Your App compresses that into one workflow, combining AI diagnostics with human expert review across seven audit layers so you get a ranked, actionable list instead of a raw data dump.
- Start with the Free plan to get a baseline scan of your site.
- Move to Solo at $49 per month for repeated audits and deeper analysis, or Founder at $129 per month for the full workflow.
- Add an Extra 3-day test at $199 one-off when you need a fast human-reviewed check on a specific change.
Check current plan details and get your first scan running on the Save Your App pricing page.
Sources
The measurement toolkit for a conversion audit splits cleanly into quantitative and qualitative sides, and both are necessary to form a hypothesis you can trust.
On the quantitative side, GA4's ecommerce event set is the backbone: view_item_list, view_item, add_to_cart, begin_checkout, purchase, and refund cover the standard flow from browsing to buying, and the GA4 developer documentation lists the exact parameters each event expects. Once those events are firing reliably, you can build event-precise funnels rather than relying on URL-based heuristics that miscount on modern, dynamic sites.
The Google Analytics Data API's runFunnelReport method generates a Funnel Visualization and Funnel Table showing step completion, abandonment counts, and abandonment rates, with breakdowns by device category and custom segments. That level of detail lets you see, for example, whether mobile users abandon checkout at a different step than desktop users, which changes what you'd prioritize fixing first.
Quantitative data tells you where; qualitative data tells you why. The toolkit here includes:
- What Is a Conversion Audit? Crucial Data for Ecommerce CRO
- Measure ecommerce | Google Analytics | Google for Developers
- How Rakuten 24's investment in Core Web Vitals increased revenue per visitor by 53.37% and conversion rate by 33.13%
A conversion audit collects both quantitative and qualitative data to identify problems and prioritize what to fix.
Baymard Institute, on the purpose of a conversion audit
Performance data deserves its own mention here because it's easy to treat as a separate technical concern rather than part of the conversion story. Real User Monitoring (RUM) captures how your site actually performs for real visitors, as opposed to lab tests run under ideal conditions, and pairing field-measured Core Web Vitals with your conversion data lets you test whether a performance fix is worth the engineering time before you commit to it.
FAQ
What is the difference between conversion and CTR?
Click-through rate (CTR) measures how many people click a link or ad out of everyone who saw it, while conversion rate measures how many of those visitors then complete a target action like a purchase or signup. A high CTR with a low conversion rate usually points to a mismatch between what an ad promises and what the landing page delivers.
Is a 12% conversion rate good?
Whether 12% is good depends entirely on your industry, traffic source, and the specific conversion point you're measuring, since a checkout completion rate and a newsletter signup rate aren't comparable numbers. Rather than chasing a universal benchmark, set your own baseline metric first and measure improvement against it over time.
What is an example of a conversion strategy?
One common strategy is simplifying a checkout flow by reducing form fields and clarifying pricing, then validating the change through an A/B test against a baseline conversion rate. Another is using session recordings and speak-aloud testing to find where users hesitate on a signup page, then testing a revised layout against the original.
Is a 2.5% conversion rate good?
As with any conversion benchmark, 2.5% only means something relative to your own baseline, industry, and traffic quality, not as a standalone number. The more useful question is whether it's higher or lower than your own historical rate, and whether a documented audit and testing cycle is moving it in the right direction.